The Forgotten Anti-Aging Classic: Retinoids Are the Skin's Best Friend

The Forgotten Anti-Aging Classic: Retinoids Are the Skin's Best Friend
Before you whip out $150 for a Goji berry skin cream, how about giving retinoids a go? (Photo by km !)

When it comes to skin care, retinoids appear to be a true star. A star among useless junk floating around the space we call cosmetics.

What other compound has decades of research behind it and been shown to actually reduce wrinkles? I can't think of any. What I can think of is new products that promise the world and cost a fortune constantly being advertised in health magazines, in the hopes that middle-aged women with deep wallets and an insatiable thirst for looking younger would fall for their marketing claims.

And they do. These anti-aging, youth-restoring, skin-plumpening, illness-curing magical creams and gels in their tiny little jars sell like there's no tomorrow. The price tag is unimportant, as long as the wrinkles will be gone.

But of course, a hundred bucks later, the wrinkles will still be there, ready to absorb the next product with its new moleculer structure that will revolutionize the cosmetic industry. I shake my head in amusement and disbelief at this sight of desperate women grabbing stacks of hard-earned or divorce-obtained cash from their Louis Vuitton purses and throwing them at salespersons, demanding to be lulled into a false dream of a wrinkle-free tomorrow.

Okay, so maybe I'm exaggerating here (I've never seen them actually throw cash), but you get the point. Why is not everyone using retinoids if they wipe the table with everything else? Maybe they aren't that good after all. Maybe it's yet another marketing trick. Maybe they were lying about retinoids too!

To find out the truth, it's time to take the red pill and do a quick review of some of the studies on retinoids, before I once again plunge myself into the wonderful but scary world of skin care in the form of an experiment. Yes, I will be trying the stuff on myself.

What are retinoids?

Retinoids are derivatives of vitamin A – that is, they are chemical compounds related to vitamin A. We absorb retinoids from foods, mainly animal sources, in the form of retinyl esters, which are then hydrolized to yield free retinol. Retinol, along with retinal, tretinoin, isotretinoin and alitretinoin, form a class known as first-generation retinoids. Etretinate and acitretin form the second generation, while tazarotene, bexarotene and adapalene form the third.

Topical retinoids were originally approved by the FDA for treating acne, but it was quickly realized that retinoids improved the skin in other ways too. Currently, three prescription-strength retinoids are available and sold under various brands: tretinoin (Atralin, Avita, Retin-A, Retin-A Micro, Renova), tazarotene (Avage, Tazorac), and adapalene (Differin). Retinol creams are generally available without a prescription, but they are also less potent.

How do retinoids work?

One mechanism behind some of the beneficial effects of retinoid is an increase in the thickness of the skin. Even though retinoids actually thin the stratum corneum – the strong, flexible and dry outermost surface of the skin – they thicken the epidermis and the dermis underneath it (link). The end result is a thicker, more youthful looking skin.

Retinoids are also powerful exfoliators. They help peel off dead skin cells on the surface of the skin and increase the turnover of keratinocytes (link). Keratinocytes, the major cells in the epidermis, move from the basal layer to the epidermis, where they differentiate and then die. The cells are thus constantly exfoliated naturally as new keratinocytes form at the basal layer. Retinoids speeds this process up and gets rid of old cells to give room to younger, healthier cells.

Furthermore, retinoids increase the production of hyaluronic acid (link, link) and collagen (link). Together they give the skin a more hydrated and firmer appearance. Retinoids also stimulate dermal fibroblasts, which are cells that make the structural framework of animal tissues (link), and replaces disorganized collagen fibers with new, well-organized fibers (link). Angiogenesis, the formation of new blood vessels, improves blood flow to the skin and is the reason behind the healthy, rosy glow reported by tretinoin users (link).

What can retinoids do for my skin?

Okay, enough technical talk; how does all this translate into real life? While retinoids are succesfully used to treat conditions such as acne vulgaris and to improve wound healing, they also have several skin health benefits in normal persons with signs of skin aging. Here's a list of positive effects seen in retinoid users, as reported in the literature (e.g. link, link, link, link, link):

  • Increased skin thickness and firmness
  • Increased skin hydration
  • Increased skin tolerance to external factors
  • Reduced visible signs of sun damage
  • Reduced fine wrinkles
  • Restoration of even skin tone and reduced hyperpigmentation
  • Reduction in dark circles under the eyes
  • Reduced skin roughness
  • Reduced irritation from shaving
  • Less risk of skin cancer
  • Reduced stretch marks
  • A healthy, 'rosy glow'

In one self-assessment, 83% of the participants rated their skin as improved after 6 months of using 0.05% tretinoin. With continued use, fine lines and coarse wrinkles keep improving, and as mentioned before, the epidermis and dermis thicken significantly. The effects are not only cosmetic in nature, as is the case with products like moisturizers, but rather reflect the fact that underlying damage is being actively repaired.

How to use retinoids

Prescription retinoids come in varying strengths: 0.025%, 0.05% and 0.1%. Since retinoids can cause skin irritation, they may take some getting used to, especially with stronger creams and gels. Common symptoms are exfoliation, stinging, burning, redness and itching, but they generally start to subside within 2 to 6 weeks. Even the strongest concentration seems to be tolerated quite well after a while (link). No abnormalities in the skin have been reported even after years of continued use, making tretinoin safe for long-term use (link).

Many people start with 0.05% strength, and if they find it too irritating, switch to 0.025%. If your skin is very sensitive, consider starting with the 0.025% and gradually moving to higher concentrations. Or, alternatively, start by using the product only every other day or even twice a week and then switch to daily use once your skin is accustomed to it.

Many of the studies have used 0.05% tretinoin with good results, but stronger creams may be even more effective (link). Retinol causes little to no irritation but produces weaker results (link). One study suggests isotretinoin, which is commonly used orally but is also available as a topical gel, may be more effective than tretinoin (link). Retinoid gels in general appear to be stronger than creams, so a 0.05% gel may be more irritant (but also more effective) than a 0.05% cream.

It is recommended that retinoids are applied in the evening or at night rather than in the morning. Some people say the reason is because they increase susceptibility to photodamage, but I haven't found evidence to support this claim. Rather, a good reason not to apply it in the morning is that retinoids themselves are degraded by sun light. Before applying, it's also recommended to wait 15-20 minutes after washing your face, presumably to reduce absorption and thus irritation.

My retinoid experiment

To see if all the pro-retinoid hype is really true, I'm going to try retinoids on myself. But, instead of just applying it on my face and trying to remember what I looked like before I started using retinoids, I'm only going to apply the product on the left side of my face.

Or, to be precise, I have two products I'm going to be testing: tretinoin cream (0.05%) and tretinoin gel (0.05%). Both are generic versions from alldaychemist.com, which sells them without prescriptions (hooray for individual choice!). I'm starting off with the cream to see how well my skin can handle retinoids in the first place.

For more information on skin care, see these posts:

Topical Vitamin C for Skin: Re-examining the Case
Silica for Hair, Nails & Skin: BioSil vs. JarroSil
How I Accidentally Grew Hair on My Left Temple with Retinol – Experiment Conclusion
Coconut Oil Is Better than Olive Oil for Atopic Dermatitis
Sugar and AGEs: Fructose Is 10 Times Worse than Glucose

Sugar And AGEs: Fructose Is 10 Times Worse than Glucose
Beware – apples are high in fructose. (Photo by Simon Pais-Thomas)

The search for answers to the AGE mystery continues. So far, we've seen that even though cooked meat is high advanced glycation endproducts, people who eat meat still have lower levels of AGEs circulating in their body than vegetarians.

One suggested explanation for this is that AGEs produced inside the body (known as endogenous AGEs) are more important than AGEs formed during cooking (known as exogenous AGEs). Specifically, the literature points to fructose being worse than glucose when it comes to AGEs. That could explain how people eating lots of fruit and no meat can still have high levels of AGEs.

It seems to be common knowledge that fructose is ten times more prone to glycation than glucose once inside the body. But is this number correct? To find out, it's time to look at some studies that have actually compared glucose and fructose in terms of endogenous AGEs.

First, a bit of background. Glycosylation is the enzymatic process that links sugars with proteins in a controlled way. Glycation, on the other hand, is the nonenzymatic linking of sugar molecules with proteins in a random way. As the name implies, glycation is the bad boy behind the formation of AGEs.

It was already known in the 1980's that glucose was not the only sugar capable of combining with proteins. Studies had shown that fructose could react with proteins in aqueous solutions and form colored, fluorescent derivatives. What was not clear was whether fructose could react nonenzymatically in mammalian tissues to form random crosslinks the same way glucose does.

The authors of an early study showed that fructation does indeed happen (link). And not only that, but also that fructose can actually cause more crosslinking than glucose:

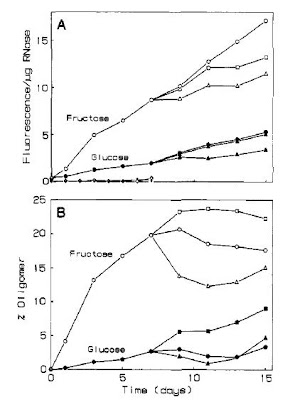
Fluorescence, crosslinking, fructose and glucose
Graph A above shows fluorescence in bovine ribonuclease from fructose and glucose, while graph B shows crosslinking from fructose and glucose. Fluorescence, which appears to happen after crosslinking and is used as a marker of AGEs, can be readily detected in skin collagen as we age (link). Combined with reduced cell proliferation, it gives aged skin that thin and fragile look. The squares in the graphs show what happened when hexose was removed from the solution, and the triangles show what happened with hexose removed and D-penicillamine added.

Here, the formation of fluorescence is about three times as great for fructose than glucose, but covalent, non-disulfide crosslinking was induced 10 times more rapidly by fructose than by glucose. On the other hand, when the authors tested them in human serum albumin, it was glucose that reacted at 8 times the rate of fructose, for reasons that are not entirely clear.

A paper published one year later concluded that the rate of protein-bound fluorescence generation was 10 times greater with fructose than with glucose (link). The authors also state that fructation converts Amadori products, which are intermediate steps in the whole process, to AGEs faster than glycation. So not only does fructose form more AGEs than glucose, it forms then faster than glucose.

Some of the discrepancies between the results from different papers may have to do with the inaccuracy of methods of measurement. One paper points out that two common glycation assays, serum fructosamine and phenylboronate affinity, would accurately measure only glucose-derived Amadori products (link). These measurements would routinely and misleadingly show glucose to produce 4- to 20-fold more Amadori products than fructose. One reason for this is that Amadori products from glucose and fructose are chemically different; the former is a ketone and the latter is an aldehyde.

The second reason is that, as mentioned earlier, Amadori products from fructose form AGEs faster than those from glucose. Therefore, looking only at the Amadori product step of the process will give the wrong picture, because some of the glycation is still in the Amadori products when fructation has already moved on.

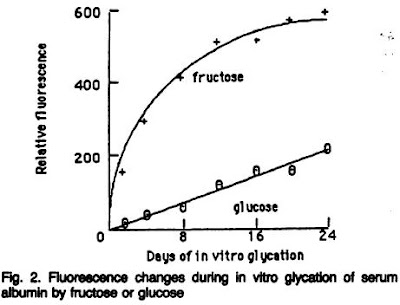
The authors then compared the effects of both fructose and glucose on fluorescence. The authors' analysis shows that fructose is indeed much more prone to glycation than fructose:

Glycation of albumin by fructose and glucose
At day 8, the difference appears to be about 8-fold. At day 24, it's about 3-fold. As the authors note, this is certainly bad news for diabetics who substitute fructose for glucose, thinking fructose is safe just because it doesn't raise insulin like glucose does. As we've seen here, things are more complicated than what they seem.

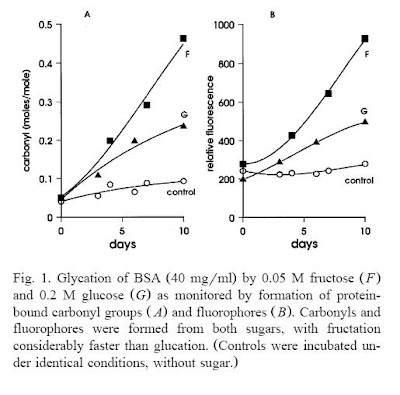
Another paper looked at the effect of glucose and fructose on fluorescence and protein-bound carbonyl groups (link). The latter are intermediate products that are featured in the formation of all AGEs. Again, the results show fructose to be much more prone to glycation than glucose:

Fluorescence, AGEs, glucose and fructose
Note that not only is the fructose graph much higher than the glucose graph, the amount of fructose was only 25% of the amount of glucose used. Exact figures are not reported, but seeing as after ten days, carbonyl formation and fluorescence appear to be a little over twice as great with just one fourth the fructose, fructose would be 8-9 times more effective than glucose. This is consistent with the earlier results.

Another paper states that fructose forms carboxymethyllysine (CML), a type of non-crosslinking AGE, up to 17 times more effectively than glucose (link). CML is a handy marker for AGEs in general, as they can be formed through glycation, fructation or lipid peroxidation, making it possible to compare various sources of AGEs.

To summarize, the claim that the ability of fructose to form AGEs is 10-fold greater than that of glucose does not appear to be too far off. In the case of fluorescence, which happens after AGE formation, the figures in the literature are consistently in the range of 8 to 10. For crosslinking, the 10-fold increase seen with fructose vs. glucose supports this, while for CML, the reactivity of fructose may be even higher.

For more information on AGEs and aging, see these posts:

AGE Content of Foods
Eating Meat or Going Vegan? Comparing AGE Levels in Vegetarians and Omnivores
The 7 Types of Aging Damage That End up Killing You
Yerba Mate Inhibits AGE Formation

Emu Oil vs. Hair Again® Topical Gel: Hair Growth Battle Conclusion

Emu Oil vs. Hair Again® Topical Gel: Hair Growth Battle Conclusion
We put a man on the moon, so why can't we grow hair? (Photo by Zach_MancesterUK)

This post marks the conclusion of the hair growth battle between emu oil and Hair Again®. The idea was to see whether either product would promote hair growth as advertised.

For the past eight months, I've been applying Hair Again® topical gel on my left temple and emu oil on my right temple. Given that the rather small can of gel has lasted me this long, it's obvious there have been occasions when I've forgotten or just decided not to use it. In particular, I've skipped applying the gel and the oil when I've washed my hair, because they tend to make my hair look greasy.

Nonetheless, I believe this is a long enough time to see results. And, since I've only applied the gel to a small area, it's not too surprising it has lasted so long. I should note that at first, I only used it on my temple, but about halfway through the experiment, I started applying it on my left eyebrow as well. In addition, I've used it on the small gap in my hairline which seems to run in the family. I occasionally but rather inconsistently applied the emu oil to my right eyebrow.

So what about the results? Well, the first observation is that nothing positive has happened on the right temple. I know emu oil is touted as some kind of ancient remedy of the Aboriginees, claimed to improve wound healing, skin wrinkling and hair growth, but I saw no such effects. It's supposed to permeate the scalp skin easily, but I found it to leave a very greasy feeling for a long time, especially if I used it on my face. Granted, the skin on the temples and on the scalp may be different, and perhaps it really does feel good on the scalp, but used in the way I used it, I can't say I liked the product.

In fact, on more than one occassion, I noticed an itching feeling and small red bumps from irritation on my right temple after applying the emu oil. That didn't happen when I put it on my face, where it just left a greasy residue. There was no change in skin smoothness and no increase in eyebrow growth.

With Hair Again®, things were a little more interesting. As you may know, I managed to grow a couple of new hairs on my left temple using a retinol cream from the same company. Those hairs are still there, and while I'm not sure whether I'd classify them as vellus or terminal hairs, they have grown to over 2 cm in length. Since the gel I used for this experiment also contains retinol, I was expecting results at least as good as with the ordinary retinol cream.

The full ingredient list is pretty impressive: coenzyme Q10, superoxide dismutase, retinol, vitamins E & D3, glutathione, beta glucan, beta carotene, beta-sitosterol, quercetin, progesterone, and melatonin. Most of these have studies behind them showing that they have the ability to grow hair in vitro, and getting all of them in one product is not a bad deal at all. But as everyone who has been tried hair growth products on themselves knows, in vitro studies rarely translate into hair growth in vivo.

And such was the case here as well. Unlike emu oil, the gel is absorbed quite nicely, and despite its yellowish color, doesn't leave your skin yellow. However, after months of use, it's still uncertain whether the product actually does anything. If I look really closely, I think I can see some vellus hair growing on the temple that weren't previously there, but the effect has definitely been more modest than with the retinol cream. Furthermore, my eyebrows have not thickened, and nothing has happened with the small gap in the hairline.

It could, of course, be that these ingredients only work on the scalp where hair is already growing. Maybe there is a crucial difference between the temples and the hairline and say, the crown. Certainly, many people report that they have more success with hair loss treatments in filling in crowns than temples and receding hairlines.

However, since it clearly is possible to grow new hairs on the temples – an area affected by androgen receptors just like the rest of the scalp – using retinol, one of two explanations come to mind: either the amount of retinol is too small, or the rest of the ingredients cancel the effect. To my knowledge, all the ingredients in the gel work by reducing androgen receptors or DHT (again, in vitro) and not by promoting hair growth per se, like minoxidil does. The fact that I saw no thickening of the eyebrows supports this view.

Therefore, my suspicion is that no matter where you apply the product, it will have a weak cosmetic effect at best. You might grow some vellus hairs, which could be useful, but I doubt it will reverse your hair loss. And if you just want to grow some vellus hairs, you might want to go with pure retinol instead. Or retinoids, if you're willing to risk some skin irritation in the beginning.

Anyway, I'm glad that the experiment is finally over, and I can move on to new and more exciting experiments. I already have a couple of good ones planned. I'll keep you posted.

For more information on hair growth, see these posts:

Eclipta Alba Extract Grows Hair Quicker than Minoxidil
Tea Tree Oil vs. Korean Red Ginseng – Hair Growth Battle Conclusion
Silica for Hair, Nails & Skin: BioSil vs. JarroSil
2% Nizoral Shampoo Increases Hair Growth More than 2% Minoxidil

Should Saturated Fat Be Avoided in Low-Carb Diets?

Butter fat is about 12% myristic acid, which increases both LDL and HDL.
Butter fat is about 12% myristic acid, which increases both LDL and HDL. (Photo by No. Meds)

Browsing through older issues of Nutrition & Metabolism, I came across an interesting article on saturated fats. It's a commentary to another article, titled "The case for low carbohydrate diets in diabetes management" (link). In the original paper, the authors argue that low-carb diets are better than traditional low-fat, high-carbohydrate diets for weight loss, blood pressure, metabolic syndrome and dyslipidemia. They also note that low-carb diets reduce triglycerides and increase HDL.

However, the authors are skeptical of the popular Atkins diet, because of its potentially high saturated fat content. Their recommendation is to limit saturated fat consumption and to use monounsaturated and polyunsaturated fats instead. So, while they succesfully dispel common myths about low-carb diets, they still propagate the myths about saturated fat being detrimental to health.

The authors behind the commentary, Volek and Forsythe, go over several myths about saturated fat and cholesterol (link). While they commend the authors of the first paper on their observations on low-carb diets in general, they note that restricting saturated fat is unnecessary.

The reason is that much of the bad reputation of saturated fat comes from overgeneralizations and misinterpretations of the data. To make a statement like "saturated fat is bad for you" doesn't really tell us much. Even if we narrow it down to saturated fat being bad for cholesterol, it still just leaves us with more questions.

Is all saturated fat bad or just some? Does the amount of saturated fat matter? Do combinations of different saturated fats behave differently than single saturated fats? And importantly, what does "bad for cholesterol" mean exactly – does it increase total cholesterol, increase LDL, decrease HDL, or something else entirely?

While the commentary doesn't answer every possible question on saturated fat and cholesterol, it does shed light on some of these questions. Since I was so inspired by this article, I've also referenced quite a few related studies not mentioned in the commentary.

First, there are different types of saturated fat. One way of categorizing fats is according to their carbon chain length, and this factor plays a part in how fats affect cholesterol levels. For example, stearic acid, which has an 18-carbon-chain (C18) and is found especially in meat and cocoa butter, does not raise cholesterol levels (link). Palmitic acid (C16) and myristic acid (C14) seems to raise cholesterol the most (link, link). Depending on the study, the cholesterol-raising effect of lauric acid (C12) is either slightly lower (link) or higher than that of palmitic acid (link). Clearly, saying that all saturated fats behave the same way is an oversimplification.

Second, the dietary context in which saturated fat is consumed plays a crucial part. Nobody eats only saturated fat. The lipid profile will depend not only on the amount of saturated fat, but also on the ratio of protein, fat and carbohydrates. Replacing carbohydrates with any fat will lower fasting triglycerides, and replacing carbs with saturated fat also raises both HDL and LDL (link). When total fat intake is relatively low, increased saturated fat intake is associated with less progression of atherosclerosis (link). Interestingly, the same study also showed that when replacing carbohydrates or protein, polyunsaturated fats were not associated with progression of atherosclerosis, but when they replaced other fats, they were.

In addition, it might makes a difference which other fatty acids are consumed with saturated fats. For example, when palmitic acid is consumed with linoleic acid (an unsaturated omega-6 fatty acid), it ceases to increase cholesterol levels (link). When dietary olive oil is replaced with palm oil, which is high in palmitic acid, no change in cholesterol is seen (link), possibly because other fatty acids are also present in the average diet.

The form in which the saturated fatty acid comes is also important. In a synthetic form, myristic acid raises total cholesterol less than palmitic acid (link). However, when compared to palm oil, myristic acid raises total cholesterol more (link). All this goes to show that it's surprisingly difficult to draw conclusions about how saturated fat from natural sources affects cholesterol levels based on studies using single fatty acids.

The third and final point is that the effect of saturated fat on total cholesterol levels is not very interesting, since total cholesterol is a poor predictor of disease. Rather, it's the effect on triglycerides, the LDL/HDL ratio, and the size of lipoprotein particles that we're mostly interested in. And, unfortunately for those who are scared of saturated fat, reducing saturated fat intake decreases HDL, especially large HDL (link). On the other hand, increasing saturated fat intake decreases triglycerides, increases HDL size (link) and increases LDL size during low-carb diets (link). High HDL combined with large LDL and HDL particle size is common among people who are long-lived (link).

As for how individual saturated fatty acids affect these factors, different studies report different findings. Most reviews on the subject agree that all saturated fatty acids except stearic acid increase LDL (link). Lauric acid has been shown to increase especially HDL (link), while stearic acid was shown to improve the ratio of total cholesterol to HDL more than palmitic or myristic acid (link). In fact, palmitic acid doesn't seem to change HDL one way or the other, whereas myristic acid increases it, albeit less than it increases LDL (link).

So, to wrap things up, the take home messages of the above are:
  1. The effect on cholesterol depends on the length of the carbon chain: in general, stearic acid is neutral, while palmitic acid, myristic acid and lauric seem to increase total cholesterol.

  2. Saturated fats don't exist in a vacuum: all the other stuff in the diet will also make a difference in how cholesterol levels are affected by saturated fat.

  3. Make sure you know what you're trying to achieve: if avoiding saturated fat, care should be taken to minimize reductions in HDL levels and lipoprotein particle size.
Of course, looking at individual fatty acids doesn't really tell us much about how saturated fats from food sources like meat, coconut, palm fruit, and butter affect cholesterol levels, but as I'm running out of time and space here, that'll have to be a subject for another post.

For more information on fat and cholesterol, see these posts:

SAs, MUFAs vs. PUFAs: Fat Storage Depends on Type of Fatty Acid in Rabbits
Blood Test Analysis: The Cholesterol and Saturated Fat Issue Revisited
Low-Carb vs. Low-Fat: Effects on Weight Loss and Cholesterol in Overweight Men
Anthocyanins from Berries Increase HDL and Lower LDL

Capsaicin and Soy Isoflavones Promote Hair Growth

A teaspoon of dried chili pepper has enough capsaicin to increase IGF-1.
A teaspoon of dried chili pepper has enough capsaicin to increase IGF-1. (Photo by Giuliagas)

This is the third post in a series about the effect of soy on hair growth. So far, we've seen that soy protein reduces DHT in men, and that soy isoflavones reduce DHT but increase testosterone in mice. While this seems like a good thing from a hair loss perspective, it doesn't guarantee that eating soy will actually prevent balding. So, time for some more studies.

The paper we'll look at today suggests that a combination of isoflavones and capsaicin grows hair in mice and in humans (link). The mice received capsaicin via injection and isoflavones through their diet, while the human participants took both orally as supplements.

Study method

For the mouse study, the mice were divided into three groups: one received capsaicin only, the second received capsaicin and isoflavones, and the third was a control group. Though the full paper doesn't explicitly state soy isoflavones anywhere and just talks about isoflavones in general, the "Fujiflavone P40" product they used in the diet is extracted from soy beans, so we can assume that the results apply to soy isoflavones.

The human study included 48 volunteers, 25 men and 23 women. 34 suffered from androgenetic alopecia (AGA), 13 from alopecia totalis (AT), and one from alopecia areata (AA). The participants were randomly divided into two groups: the first one received 6 mg capsaicin and 75 mg isoflavone daily, and the second received placebo only.

Capsaicin and IGF-1

Insulin-like growth-factor 1 (IGF-1) is involved in promoting hair growth in humans and animals. Indeed, mice that have been genetically modified to overexpress IGF-1 develop hair follicles earlier than controls, and humans with an IGF-1 deficiency have sparse hair growth. One explanation is that IGF-1 produced by dermal papilla cells might promote hair growth through stimulation of keratinocyte proliferation in hair follicles.

When the mice in this study were administered capsaicin, their dermal levels of insulin-like growth-factor 1 (IGF-1) increased significantly. On the other hand, CGRP-knockout mice did not show increased IGF-1. The authors suggest that increased CGRP, or calcitonin-gene related peptide, production leads to increased IGF-1, which in turn leads to hair growth.

In mice, the combination of capsaicin and isoflavone increased IGF-1 more than capsaicin alone. This makes sense, since isoflavone increases CGRP production. In humans, IGF-1 levels were increased after 5 months in the participants taking capsaicin and isoflavone orally, while they were not increased in those receiving placebo.

Capsaicin, isoflavone and hair growth

After four weeks of treatment, the rats receiving either capsaicin or capsaicin and isoflavone had grown more hair then the control rats. Consistent with the observed increases in IGF-1, the combination of isoflavone and capsaicin was more effective than capsaicin alone.

Effect of cayenne and isoflavone on hair growth in mice
The leftmost image above shows three of the control rats after 4 weeks. The center image is of the capsaicin group, and the rightmost image is of the capsaicin + isoflavone group.

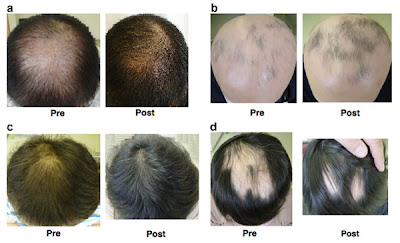
After 5 months, hair growth was significantly increased in 64.5% of human volunteers administered with capsaicin and isoflavone, compared with 11.8% in the placebo group. Furthermore, 88% of the participants suffering from androgenic alopecia saw a promotion of hair growth when given capsaicin and isoflavone. This suggests that the treatment might be more effective for male-pattern baldness than other types of hair loss. Below are some samples of the humans treated with oral capsaicin and isoflavones.

Effect of cayenne and isoflavone on hair growth in humans
The upper left picture (a) is of a 54-year-old male with androgenic alopecia. That's a pretty significant result right there. The picture in the upper right corner (b) is of a 29-year-old male with alopecia totalis. Some hair growth is evident, but not a full recovery. The lower left corner (c) is of a 39-year-old female with androgenic alopecia, showing some thickening of the crown area. The lower right corner (d) is of a 40-year-old female with alopecia areata.

Conclusion

A combination of soy isoflavones and capsaicin increases dermal levels of IGF-1 and promotes hair growth in humans and mice. While some in vitro studies have suggested IGF-1 to be deleterious to hair growth, this study shows that the result may be different in vivo.

The amounts used in the study are quite reasonable. Chilli, cayenne pepper and red pepper contain between 0.1 mg to 60 mg capsaicin per gram (link, link, link, link). Given that a tablespoon of ground spice weighs about 8 grams, one tablespoon of ground chili pepper would contain anywhere between 0.8 mg and 480 mg of capsaicin. The hotter the pepper, the more capsaicin it contains.

As for soy, the best source of isoflavones are soy beans, which contain about 200 mg isoflavones per 100 grams (link). Tofu contains ~35 mg per 100 grams, while soy milk contains only ~9 mg. Thus, to get the 75 mg used in the study, you would either need to eat about 40 grams of soy beans (dry weight), a little over 200 grams of tofu, or a little less than a liter of soy milk.

Both capsaicin and soy isoflavones (mainly daidzein and genistein) are also commonly available as supplements.

For more information on soy, cayenne and hair growth, see these posts:

Do Flax Lignans Reduce Hair Loss from MPB?
Soy Protein Isolate Reduces DHT in Healthy Young Men
Green Tea and Capsaicin Reduce Hunger and Calorie Intake
Emu Oil and Hair Growth: A Critical Look at the Evidence

Anti-Aging in the Media: Daily Telegraph on Curing Aging

Making it to a 1,000 years old is possible if you're still young.
Making it to a 1,000 years old is possible if you're still young. (Photo by pedrosimoes7)

Seems like the mainstream media has been a little quiet on anti-aging news in the past few months. Maybe the summer has had something to do with it. No time to worry about getting old and dying when the sun is shining outside!

Thankfully, The Daily Telegraph is here to remind us that autumn is coming fast and death lurks around every corner again. In an article titled "Could there be a cure for ageing?" Danny Penman takes a peek at what the future has in store for us.

I've often expressed my surprise at the positive tone of many of these pieces, but I guess I should stop being surprised and just accept that perhaps the tides are turning for good. Sure, there will be an uproar against rejuvenation therapies from irrational people, but it's good to see reporters with an optimistic attitude towards life extension.

Mr. Penman even mentions the fourth Strategies for Engineered Negligible Senescence (SENS) conference that took place a few weeks ago. He quotes Aubrey de Grey in the article:

"Conventional medical progress has ensured that a child born today can expect to live 120 to 150 years. I think it's possible for them to live far longer. If we make the right breakthroughs in the next 25 years, then there is a 50:50 chance that people alive today could live to be 1,000 years old."

Such optimistic estimates are nothing new from de Grey, but usually he's shared them with people who are already life extensionists and expressed his predictions in more conservative terms for the mainstream crowd. Apparently people accept lifespans of 200 to 300 years more easily than living to be 1,000 years old. The fact that he mentions this figure will probably seem very radical to most readers, but as de Grey himself says, the true implications of rejuvenation therapies are lifespans measured in millions of years.

There is, of course, always the chance that none of us alive today will get a ticket for the ride. Our lifespans will, on average, probably be greater than those of previous generations even without any dramatic interventions, but the ultimate goal of every sensible life extensionist is making it to escape velocity:

The "normal" rate of medical progress ensures that life expectancy increases by about two years every decade. This ensures that for every hour that passes, you have gained 12 minutes of life expectancy. Accelerate the rate of progress, and you stand a chance of achieving "take-off"– the point at which life expectancy increases faster than the population ages.

The article briefly mentions the disposable soma theory of aging – which has to do with evolution favoring reproduction over maintenance – and goes over the seven types of aging damage. Then, after an obligatory discussion of modern plaques like diabetes and Alzheimer's and how solving aging is related to them, there's a more exciting part:

Custom-building body parts – or even replacing whole limbs – may seem like the realm of science fiction but this may soon become reality.

Already scientists routinely produce skin and simple body parts, such as ears. Twelve years ago, the world was stunned by the picture of a human ear growing on the back of a mouse. Since then, the technique has advanced so fast that body parts are now routinely grown in vats rather than in animals. More than 300,000 people have now received such tissue-engineered body parts.


I'm pretty sure most people are generally unaware of the progress being made in tissue engineering. I think it's a very promising field, if only for the fact that replacing limbs with artificial ones will likely go down with the public better than the whole "let's live forever" concept. A few decades ago, being paralyzed in many ways resembled a death sentence – because who would want to stare at the ceiling in a hospital bed for the rest of their life? – but with technologies such as tissue engineering, it'll be only a temporary problem.

In the name of objective journalism, the anti-anti-aging crowd gets their voice heard too. Representing the pessimist side is Dr. Richard Faragher (who happens to be chair of the British Society for Research on Ageing, by the way!) whose vision of how we should spend our resources are somewhat different:

"Aubrey is effectively a science-fiction writer," says Dr Faragher. "There are many ways that public health can be improved through simple measures such as managing hip fractures more effectively. We should be focusing on these things rather than dreaming about immortality."

The fact that this dimwit is involved in deciding how funds for ageing research are spent is beyond me. He seems to think that desperately treating hip fractures as the population gets older and older is a better long-term solution than trying to fix the very problem of aging. A geriatric approach if I ever saw one.

As Henry David Thoreau said, "There are a thousand hacking at the branches of evil to one who is striking at the root."

For more information on anti-aging and immortality, see these posts:

How to Live Forever: My 5 Steps to Immortality
Biotechnology and the Future of Aging
Who Wants to Live Forever? Results from a Global Survey
Anti-Aging in the Media: New York Times on Caloric Restriction and Resveratrol

Two Brave Men Who Ate Nothing But Meat for an Entire Year

Stefansson and Andersen make paleo dieters look like vegans.
Stefansson and Andersen make paleo dieters look like vegans. (Photo by sheilaz413)

Low-carb diets and paleolithic nutrition are all the rage these days, and for good reason. Compared to the Standard American Diet, both of them are superb.

Few of us would dare to take the two to their extreme, however. Giving up sugar and wheat is one thing, but what about giving up everything except meat? Yes, I'm talking about an ultra low-carb diet with even foods like nuts and berries removed. Unsurprisingly and understandably, studies on the long-term effects of such a diet are severely lacking.

There is at least one study that did just this, however. If the diet brings the Eskimos to mind, it's no coincidence. You may have heard of Dr. Vilhjalmur Stefansson – the Canadian ethnologist who spent more than a decade with the Inuit during his arctic explorations in the beginning of the previous century. For nine of these years, he lived almost exclusively on fish and meat (you can read about his experiences here). At the time, this was considered heresy and life-threatening, just as it is today (note that Stefansson apparently refers to both fish and meat with the word "meat"):

A belief I was destined to find crucial in my Arctic work, making the difference between success and failure, life and death, was the view that man cannot live on meat alone. The few doctors and dietitians who thought you could were considered unorthodox if not charlatans. The arguments ranged from metaphysics to chemistry: Man was not intended to be carnivorous - you knew that from examining his teeth, his stomach, and the account of him in the Bible. As mentioned, he would get scurvy if he had no vegetables in meat. The kidneys would be ruined by overwork. There would be protein poisoning and, in general hell to pay.

To the surprise of many (including Stefansson himself), he suffered no health problems during his decade of pure carnivorism. When he told people of his amazing experiences, he was met with skepticism from medical authorities who asked him to undertake a study that would replicate the results. He and a fellow explorer named Andersen agreed to eat an all-meat diet for an entire year in a closely observed setting.

Composing a diet of nothing but meat and fat

This time, however, the diet was even more radical than the traditional Eskimo diet, which is based on fish and includes a small amount of berries and vegetables – not a lot, but enough to keep them out of ketosis most of the time. Furthermore, since fish is high in omega-3 fatty acids, you could argue that it's all those good fats that keep the Eskimos free of disease.

But how could anyone subscribing to conventional health wisdom explain thriving on a diet consisting solely of red meat? No vegetables, no fruit, no vitamin supplements. Nothing. Just meat and animal fat.

The results of this fascinating study were published in 1930 in the Journal of the American Medical Association (link). At the beginning of the experiment, Stefansson was given only lean meat at the request of his supervisors. This was to confirm Stefansson's bad experiences with low-fat meat; during his explorations, there had been periods during which fat was not readily available and which lead to diarrhea and nausea in a few weeks. This time, the illness kicked in much earlier:

As said, in the Arctic we had become ill during the second or third fatless week. I now became ill on the second fatless day. The time difference between Bellevue and the Arctic was due no doubt mainly to the existence of a little fat, here and there in our northern caribou - we had eaten the tissue from behind the eyes, we had broken the bones for marrow, and in doing everything we could to get fat we had evidently secured more than we realized. At Bellevue the meat, carefully scrutinized, had been as lean as such muscle tissue can be.

After fat was added back into the diet, a full recovery was made in two days. The authors of the study describe the diet from then on:

The meat used included beef, lamb, veal, pork and chicken. The parts used were muscle, liver, kidney, brain, bone marrow, bacon, and fat.

Thus, fat played an important part in their diets. According to the authors, Andersen usually ate beef, while Stefansson often chose lamb. Both men ate about 800 grams of meat per day in 3-4 meals. The protein contents ranged from 100 to 140 grams, the fat from 200 to 300 grams, and carbohydrates from 7 to 12 grams. In calories, the percentages were 15-25% protein, 75-85% fat, and 1-2% carbohydrate. The carbs came solely from the glycogen of the meat, making this not so much a low-carb as a no-carb diet. In addition to water, coffee and tea were allowed throughout the period.

Health markers after one year

Examinations at the end of the observation showed that both men were healthy while on the diet. The authors write:

There were no subjective or objective evidences of any loss of physical or mental vigor. The teeth showed no deterioration and gingivitis had disappeared. There was, however, an increase in the deposit of tartar on the teeth of [Stefansson]. Bowel elimination was undisturbed.

Though neither man was overweight to begin with, and weight loss was not the goal of the experiment, both men lost a few pounds during the year. This was despite the fact that calorie intakes ranged from 2,000 to 3,100 kcal. Stefansson averaged about 2,650 kcal (2,100 from fat and 550 from protein), while Andersen averaged 2,620 kcal (2,100 from fat and 510 from protein).

Given that Stefansson, the taller of the two, was 180 cm (5 feet 11 inches), and both of them were fairly sedentary, this represents a significant amount of calories without any weight gain. During the first weeks, weight loss was more significant, apparently due to a shift in the water content of the body. Both men appeared "ruddier" at the end of the experiment than at the beginning.

Blood pressure did not increase in either subject. Stefansson's blood pressure remained at 105/70 mm. throughout the study, while that of the other subject decreased from 140/80 to 120/80 mm. Salt intakes were fairly low.

No physical fatique or problems sticking to the diet were experienced by the two men. Only when the protein content of the diet increased substantially (45% of calories, 55% fat) did problems with digestion occur. Replacing excess protein with fat (20% protein, 80% fat) quickly resolved them, however.

No clinical evidence of vitamin or calcium deficiency was noted, despite the diet being both acidic and low in calcium. In addition, the mild gingivitis Stefansson had suffered from, cleared up entirely during the meat diet. Interestingly, Andersen reported that his hair stopped falling out shortly after the meat diet was started; Stefansson also noted his hair started growing thicker and his scalp was healthier.

Acetone bodies in daily averages per experimental period ranged from 0.4 to 7.2 gm, with the maximum excretion measured during the year being 12.3 gm. The acidity of the urine showed a 2-to 3-fold increase, which is consistent with the highly acidic nature of the diet. A slight increase in uric acid nitrogen was found during the first three months only.

All in all, no evidence of irritation to the kidneys was found – despite the fact that these men were in ketosis practically for an entire year. A higher degree of ketosis was noted when the fat content of the diet increased and the protein content decreased. Acetone bodies quickly disappeared when carbohydrates were introduced into the diet.

In general, the men were in ketosis whenever the ratio of fat to carbohydrates was over 1.5. With the extremely small amounts of carb in their diets, no definite relation between the amount of acetone bodies and the ratio of fat to carbs was found. Stefansson's friend, who was smaller and had less subcutaneous fat, had the highest sustained ketosis.

Seven years after the meat diet

In 1935, one of the authors published an article titled "A Year's Exclusive Meat Diet and Seven Years Later", in which he revisits Stefansson's case (link). First, he summarizes the main points of his earlier article from 1926, titled "The Effects of an Exclusive Long-continued Meat Diet". The following medical facts regarding Stefansson's life during his explorations are listed:

  1. He spent altogether altogether eleven and one-half years within the Arctic Circle.
  2. He lived for a number of days, totaling nine years, on an exclusive meat diet.
  3. He lived for nine successive months on an exclusive meat diet.
  4. He reached his maximum weight while subsisting on meat (fish).
  5. His sense of physical and mental well being was at its best during that period of his life.
  6. He found that the exclusive meat diet worked as well when he was inactive as when active, and as well in hot weather as in cold.
  7. Constipation was never present. One month's entire absence from exercise produced neither constipation nor muscular weakness. (Stefansson avers that not a single case of constipation was observed in 600 exclusively meat-eating Eskimos for a period of three years).
  8. His hair thickened, and his scalp became healthier.
  9. Tooth decay was apparently much less rapid.

Seven years after the meat diet study, the author examined Stefansson again, who apparently had reacquainted himself with some aspects of the Western diet. Instead of eating only meat, he was now eating a breakfast of one egg, bread and coffee, and a dinner and supper consisting of a moderate amount of meat, vegetables, and some cheese. His fruit and milk intake remained negligible.

During this period, Stefansson had put on quite a bit of weight. He now weighed 84 kg, compared with 70.8 kg in 1922 and 72.5 in 1928. His hair was as thick as before, but his gingivitis had returned. Blood pressure was up to 120/80 mm. All in all, the author states Stefansson was in excellent general health. Looking at the numbers, however, it seems that he was doing better on his monotonous carnivore diet.

While it would be interesting to replicate the study with a larger sample size and have more health markers measured than the ones used in the study, it is quite remarkable to see that a diet consisting of nothing but meat and animal fat is both feasible and, apparently, healthy. It also lends support to the importance of having a sufficient amount of fat in the diet, especially when protein is present in significant quantities.

For more information on diets and health, see these posts:

Red Meat and Mortality: A Closer Look at the Evidence
A Typical Paleolithic High-Fat, Low-Carb Meal of an Intermittent Faster
SAs, MUFAs vs. PUFAs: Fat Storage Depends on Type of Fatty Acid in Rabbits
Protein, Vitamins and Wound Healing

The President is Coming to Class

At the end of last week when I heard about all the drama about President Obama giving a speech to school children I felt compelled to say something. I wrote something up and asked my colleague Doyle Stevick if he wanted to join in. We submitted the op-ed below to The State newspaper. It didn't run, which wasn't entirely unexpected since we sent it in over Labor Day weekend. But since it's written, I thought we might as well toss it up on the Internet for a few people to read. (When we wrote it President Obama's remarks were not available, but they are now on the White House web site.)

***
Op-ed for The State Regarding President Obama's Speech to School Children
By Christian K. Anderson and Doyle Stevick

President Obama will deliver a live address this Tuesday for all school children in the United States in order to “urge students to take personal responsibility for their own education, to set goals, and to not only stay in school but make the most of it.” Some parents and conservatives are concerned that the speech may come from the Democratic politician rather than from the American president.

Given reasonable concerns about politicizing our schools, it is important to ask two questions: Is the subject important enough to justify such an event, while the country grapples with wars, foreclosures, unemployment, health care politics, and the like? And if so, is it worth the risk of politicizing schools to show such a speech in schools?

On the first question, the evidence seems to be clear: when children succeed in school, the outcomes for the student and for the country are tremendous. Students who earn a high school diploma are more likely to vote, to donate to charities, to volunteer and even to give blood. They live healthier lives. Drop-outs are at much higher risk of being sent to prison and of relying on public assistance; both outcomes impose huge costs on taxpayers.

A recent College Board study showed that dropouts 25 and older earn, on average, about $23,400 compared to $31,500 for a high school graduate. The positive effects of education are multiplied for those who attend and graduate from college. A college graduate averages nearly $51,000. Over a lifetime, this translates into hundreds of thousands of dollars for the individual, and their spending boosts the economy.

It is no wonder the South Carolina Commission on Higher Education argues in its recent study, “The Economic Return on Investment in South Carolina's Higher Education,” that South Carolina’s future depends on how well we are able to educate our children.

We have schools that lack resources, where children—white, black, Hispanic, foreign—may question our commitment to their education. If they have mixed feelings about their schools, they may also question whether learning really does offer a light at the end of the tunnel.

In this regard, President Obama’s journey is more important than his politics. Whatever we think of his policies, it was his education that enabled him to become president. The fact that he is president provides powerful testimony to the power of education in overcoming barriers. If the president’s message is about the power of education, then the message is a critical one for all of our children.

But will his speech be political instead of non-partisan? We believe that our leaders may disagree about how best to help schools and children, but that they all see our children as America’s future and understand education’s role in making that future bright. If they didn’t, President Bush would not have pushed for No Child Left Behind, and President Obama would not have dedicated so much of the Recovery Act funds for schools. For these reasons, we would be surprised if the president discredited himself by politicizing such a crucial opportunity to encourage children.

While we can’t know precisely what he will say, it seems that the potential benefits may outweigh the risks. The symbolism of a president choosing to emphasize education at a time when the nation faces so many challenges is a powerful message in and of itself. It demonstrates that we cannot lose sight of the long-term solutions even as we are faced with the crises of the day.

For educators, the speech is a welcome opportunity to discuss the role and importance of education. For families, it is a chance to talk with their children about why we send them to school for so many years at such great expense: most children have never thought much about it. And all parents, from liberal to conservative, have an opportunity to talk to their children about the content of his speech, and why it supports—or contradicts—our personal values.

The President’s speech cannot solve our state’s chronic dropout problem, but let us not forget the power of inspiring words. We landed men on the moon, pushed Civil Rights forward, and tore down the Berlin Wall in part due to the inspired words of national leaders.

If President Obama’s speech to children can inspire children to think more deeply about the value and purpose of education, it is time well spent.

Christian K. Anderson and E. Doyle Stevick are assistant professors of educational leadership and policies at the University of South Carolina. The opinions expressed are their own and do not represent those of the University.

Why Aging Is a Global Disaster That Needs to Be Solved


I've written about aging and dying (and how to avoid them) mostly from a subjective standpoint on this blog, but there are also objective reasons for curing aging. The world's population is growing old, and it's going to be a big problem for everyone.

The LifeStar Institute has published a promotional video detailing what's wrong with aging from a global perspective. The mission of the LifeStar World Health Initiative is:

To dramatically mitigate the negative consequences of global aging within 20 years by preventing the loss of productivity associated with chronic disease through ensuring approaches able to restore physiological and cognitive function are developed and made available to all humanity.

The video does a really good job of showing how aging is not just a personal tragedy but also a financial catastrophe. So even if you find the concept of becoming frail, forgetful, and completely dependent on other people somehow comforting, you will probably find it much less comforting that in a few decades, there will simply be too many mouths to feed for elderly healthcare to work as intended.

The entire social security system is based on the premise that the next generation provides for the previous generation. A state-mandated version of the ancient system of the young taking care of the old. Like a true Ponzi scheme, it rests on the assumption that there will be a next generation. If there isn't, the system suddenly collapses. If the next generation is always slightly smaller than the previous generation, the system crumbles, slowly but surely.

In developed nations, birth rates are declining, and the general population is getting older. In 20 years, one in four individuals will be over 60. This means a dramatic increase in healthcare costs, as treating age-related conditions is responsible for the overwhelming majority of these costs. And yet, where will all that money come from when a large part of the population is waiting for treatment instead of working?

In about five minutes, LifeStar Institute video manages to brilliantly expose the fallacy of supporting medical treatment of aging-related diseases while opposing the treatment of aging itself – which is how the majority thinks at the moment, unfortunately. It's equivalent to saying you support someone living five years longer but oppose that they live ten years longer. Or that you support giving morphine to a patient but not curing their illness. Pain relief is really what treating age-related conditions is.

So much money is directed into treating the symptoms that we've become blind to the underlying problem: aging. Even worse, when the blind are made to see, the tired old objections echo all over again. What about death being an essential part of nature? What about accepting things as they are? What about overpopulation? What about limited resources?

All of these probably deserve a refutation (a subject for future posts), but all of them are completely insignificant in the face of the catastrophe of aging. Aging sweeps the floor with all of them. No matter how big a problem overpopulation might theoretically be – because in practice it won't be – it is nothing compared to the fact that aging kills more people every day than anything else. Infections, wars, natural disasters, all are tiny drops in the bucket.

The problem of aging is of such a magnitude that it doesn't even register as a problem in most people's minds. This line of thinking needs to be changed, because the problem can be solved. And sooner or later, it will be solved – the question is only whether you and I will be there to witness it.

For more information on aging and how to solve it, see these posts:

Taking Life Sciences to an Extreme: From Homo Sapiens to Homo Evolutis
The 7 Types of Aging Damage That End up Killing You
Biotechnology and the Future of Aging
Anti-Aging in the Media: Vancouver Sun on Immortality

Eating Meat or Going Vegan? Comparing AGE Levels in Vegetarians and Omnivores

Vegetarians have higher levels of AGEs than meat-eaters.
Vegetarians have higher levels of AGEs than meat-eaters. (Photo by Sandy Austin)

As a continuation of my previous post on the AGE content of foods, I'm currently going through a ton of papers on AGEs and desperately trying to organize them into blog posts in some sensible way.

In general, it seems that there is a lot of information on AGEs in vitro, but much less in vivo data. Specifically, only a few studies have looked at how various diets affect the accumulation of advanced glycation endproducts in humans – which is what we're really interested in, after all.

One of these studies compared serum levels of AGEs in omnivores and vegetarians (link). While this is from a few years back and has already been discussed on other blogs, I think it deserves another look. The full paper has some interesting details not mentioned in the abstract.

Since almost any variation of a vegetarian diet is lower in exogenous AGEs (that is, AGEs formed outside the body) than meat-based diets, the authors expected vegetarians to have higher levels of plasma AGEs. The surprising result of the study was that the vegetarians had higher levels of AGEs – despite consuming much lower amounts of AGEs in their diet. This means that endogenous AGEs (those formed inside the body) played a bigger role than previously thought.

The vegetarian and omnivore diets

So what did the diets look like in practice? Instead of one "vegetarian diet", there were in fact three different vegetarian diets: a vegan diet (V: plant foods only), a lacto-ovo-vegetarian diet (VLO: plant foods, milk, eggs, dairy products), and a semi-vegetarian diet (VS: the same as VLO but with fish). And then there was the omnivore diet (O), which was a traditional Western mixed diet without any food limitations. Here's a breakdown of the diets:


The composition of omnivore and vegetarian diets
Looking at the table, we can see a few important differences between the diets. First, protein consumption was lower in all the vegetarian diets compared to the omnivore diet. Second, perhaps surprisingly, carbohydrate consumption did not differ significantly between groups – if anything, the omnivores ate more carbs. Total calorie intake is not reported, but since the BMI was lower among vegetarians (especially vegans), they probably consumed less calories in general.

The third and most important difference is the amount of fructose in the diet. All vegetarians ate more high-fructose vegetables and fruits than the omnivores. The vegans ate more than twice the amount of high-fructose fruits than the omnivores. The difference in citrus fruit consumption between omnivores and vegetarians is very big. Vegetarians also consumed more honey. Interestingly, the omnivores drank more fruit juices than the VS and VLO groups, while vegans drank the most.

In addition, the vegetarians consumed less milk, yogurt, cream and cheese but more legumes than omnivores. Total grain product consumption was similar in all groups, but the intake of unheated processed grain products (such as muesli and oat flakes) and whole grain products was 3 to 6 times higher in vegetarians. On the other hand, cooked and baked grain product intake was higher among omnivores. So basically, the omnivores were eating their share of white bread, while the vegetarians favoured things like whole grain pasta.

Vegetarians, omnivores and AGEs

Two plasma measures of AGEs were used in the study: fluorescent AGEs and CML. Both are common markers of circulating AGEs. The amount of fluorescent AGEs in plasma was lowest in omnivores and highest in lacto-ovo-vegetarians. Among vegetarians, vegans had the lowest fluorescent AGE levels. The differences became more clear when AGEs were adjusted for the amount of protein in plasma. Therefore, if the vegetarians had consumed as much protein as the omnivores, their AGE levels would probably have been even higher. Still, even with this adjustment, vegans still had lower levels than other vegetarians.

The amount of CML in plasma followed a similar trend. Again, omnivores had the lowest levels, but this time semi-vegans had the lowest levels among vegetarians. Lacto-ovo-vegetarians had the highest levels, and vegans had somewhere in between.

So what could explain these findings? The authors rule out the possibility of age being a factor here, since plasma levels of CML and fluorescent AGE are not significantly different in the age bracket of 30-60 years. Both values are useful mostly as short-term markers of endogenous and exogenous AGEs. Indeed, neither measure tells us much about the tissue accumulation of AGEs, except that high serum levels of AGEs most likely cause high tissue levels of AGEs in the long run.

Carbohydrate consumption is also unable to explain the difference in AGE levels between omnivores and vegetarians.
Since there were no significant differences in fasting blood glucose levels between the groups, and the omnivores ate more carbohydrates, elevated blood glucose levels are probably not reason for increased glycation in vegetarians. Also, the omnivores ate less whole-grain products, so clearly, the explanation for higher AGE levels in vegetarians can't be that they should have chosen "healthier" grain products instead.

Inflammation and oxidative stress are also out of the question, because inflammation markers were within the normal range in all participants, and plasma antioxidant levels were actually higher in vegetarians. Furthermore, lipid peroxidation was lower among vegetarians.

Does meat protect from the effects of fructose?

Two possible explanations come to mind: either the higher fructose consumption among vegetarians resulted in higher levels of endogenous AGEs, or there is something in animal protein sources that protects from AGEs.

Fructose is indeed much more prone to glycation than glucose (link), which would explain why the same carbohydrate intake can result in different AGE levels depending on the ratio of fructose to glucose. On the other hand, if this were the only explanation, then one would expect to see the highest levels of AGEs in vegans, who presumably ate the most fructose. Yet, it was the lacto-ovo-vegetarians who had the highest levels. The VLO group ate less high-fructose vegetables and fruits, less honey, and less fruit juices than vegans.

What about the animal protein explanation? Vegans obviously consumed no animal protein at all, while the VLO group consumed less than the semi-vegans and much less than omnivores. They consumed less protein in general, despite eating the most legumes. It seems unlikely that animal protein from dairy products had a significant protective effect, because semi-vegans and lacto-ovo-vegetarians ate dairy products while vegans didn't.

It has been hypothesized that a deficiency in taurine is the reason vegetarians have higher AGE levels and that taurine supplementation might bring AGE levels down (link). Since taurine is found mostly in meat and seafood, strict vegan diets have very little taurine. Carnosine is another molecule found mostly in animal sources. Both carnosine and taurine prevent glycation in vitro. Unfortunately, taurine and carnosine intakes between the groups were not measured in this study, and there are no human studies on glycation in vegans supplementing with taurine and/or carnosine.

Neither of these explanations is entirely sufficient. If fructose is the main cause of serum AGEs, and carnosine and taurine protect from glycation, then one would expect to see the highest levels of AGes in those who eat the most fructose and the least carnosine and taurine – vegans. But this is not the case. The amount of AGEs in food is obviously also not the only explanation, because omnivores must have consumed the most AGEs and vegans the least.

It's quite possible that a combination of all these factors is the reason behind the differences in AGE levels. Meat is very high AGEs, and yet eating meat does not result in huge levels of AGEs in the serum. On the other hand, eating very little AGEs with food does not guarantee low serum levels of AGEs. Perhaps eating foods somewhat high in AGEs and fructose while not eating meat is the worst combination of all, as the high levels of AGEs in lacto-ovo-vegetarians seems to indicate.

I will continue with the AGE theme in upcoming posts, once I finish reading the papers and making more sense out of all this.

For more information on diets and glycation, see these posts:

Yerba Mate Inhibits AGE Formation
The 7 Types of Aging Damage That End up Killing You
Green Tea Reduces the Formation of AGEs
A High-Protein Diet Is Better than a High-Carbohydrate Diet for Weight Loss

AGE Content of Foods

Hot dogs are high in AGEs.
Hot dogs are high in AGEs. (Photo by TheBusyBrain)

There are two ways that advanced glycation endproducts (AGEs) are formed: inside the body or outside the body. These are known as endogenous and exogenous AGEs, respectively. The accumulation of AGEs is one of the seven types of aging damage.

While it's uncertain just how big a role exogenous crosslinks play in aging, consuming excess amounts of AGEs through diet has been shown to cause serious health problems in animals and humans. Therefore, it seems useful to have some idea of which foods are especially high in AGEs.

The following is a list of the AGE contents of commonly consumed foods. Currently, the data is based on one study (link). The authors state:

Two-hundred fifty foods were tested for their content in a common AGE marker (epsilon)N-carboxymethyllysine (CML), using an enzyme-linked immunosorbent assay based on an anti-CML monoclonal antibody. Lipid and protein AGEs were represented in units of AGEs per gram of food. --

-- A limitation of the present data is reliance on CML, a single AGE marker, while many other AGEs/ALEs are generated in food, albeit of unknown significance. In practical terms, however, CML is a commonly measured AGE/ALE compound, used routinely as an indicator of the AGE/ALE burden in numerous animal and human studies

Other ways of measuring AGEs might produce different values, so the numbers below serve mostly to give a rough idea of the relative AGE contents of foods. If you want to compare your own intake with others, here's a quote from the full paper:

In a preliminary survey of the usual daily AGE intake, we analyzed 3-day food records from healthy individuals (n=34). Mean daily AGE intake was 16,000±5,000 kU AGE. These data were used to define a high- or low-AGE diet, depending on whether the estimated daily AGE intake is significantly greater or less than 16,000 kU AGE. A similar investigation in 40 type 2 diabetic patients showed a daily AGE intake of 18,000±7,000 kU AGE, with major proportions of AGE contributed by broiled, fried, grilled, and roasted meat and meat alternatives.

So anything above 16,000 kU (see the list below for values) per day would put you in the high-AGE category. Again, keep in mind that we are talking about crosslinks produces outside body; whatever happens once the foods are digested, important as it may be, is beyond the scope of this post. Based on the data, we can make the following generalizations:

  • Fats and meat products contain the most AGEs
  • Carbohydrates are relatively low in AGEs
  • Higher cooking temperatures increase AGEs
  • Longer cooking times increase AGEs
  • The presence of liquids in cooking reduces AGEs
  • Processed foods have more AGEs than natural or homemade foods

I will try to keep this post updated as I come across new data to include in the list, so remember to check back every now and then. Below, AGEs are expressed either as units per gram (for solids) or units per milliliter (for liquids). Serving sizes are grams, and AGEs per serving are expressed as kilounits.


FatsAGEs (U/g)
Serving (g)
AGEs/serving (kU)
Almonds, roasted66,514301,995
Avocado15,77230473
Butter264,87351,324
Cashews, roasted 98,082 30 2,942
Cream cheese, Philadelphia soft 108,843 30 3,265
Margarine, 60% vegetable oil175,1925876
Mayonnaise 94,0105 470
Mayonnaise, imitation 2,000 5 10
Mayonnaise, low fat 22,011 5 110
Olive, ripe16,68630501
Peanut butter, smooth 75,183 30 2,255
Walnuts, roasted 78,874 30 2,366
Salad dressing, Caesar7,37115111
Salad dressing, French, Lite 11 15 0
Salad dressing, Italian, Lite 8 15 0
BeefAGEs (U/g)
Serving (g)
AGEs/serving (kU)
Frankfurter, boiled 7 min74,850906,736
Frankfurter, broiled 5 min112,697 90 10,143
Hamburger, fried 6 min 26,391 90 2,375
Hamburger, fast food 54,176 90 4,876
Meatball, boiled in sauce 1 h 28,519 90 2,567
Meat loaf, crust off, roasted 45 min 18,619 90 1,676
Roast beef 60,708 90 5,464
Shoulder cut, boiled 1 h 22,305 90 2,007
Shoulder cut, broiled 15 min 59,636 90 5,367
Bacon, microwave 3 min 90,228 13 1,173
Deli ham, smoked 23,491 90 2,114
Pork chop, pan fried 7 min47,526 90 4,277
Beef and pork links, pan fried 54,255 45 2,441
Sausage, pork links, microwave 1 min 59,438 90 5,349
PoultryAGEs (U/g)
Serving (g)
AGEs/serving (kU)
Chicken breast, skinless cubes, pan fried 15 min 61,221 90 5,510
Steamed 10 min and broiled 12 min 56,348 90 5,071
Pan fried 10 min and boiled 12 min 63,398 90 5,706
Chicken breast, skinless cutlet, raw 7,686 90 692
Boiled 1 h 11,236 90 1,011
Broiled 15 min 58,281 90 5,245
Fried 8 min 73,896 90 6,651
Microwave 5 min 15,245 90 1,372
Chicken breast, with skin, roasted 45 min 60,203 90 5,418
Chicken, dark meat, broiled 1 h 82,992 90 7,469
Chicken loaf, roasted, crust off, 45 min 14,195 90 1,278
Chicken nuggets 86,271 90 7,764
Turkey breast, cubes, skinless, broiled 55,747 90 5,017
Turkey breast steak, skinless, broiled 43,873 90 3,949
Smoked turkey breast, seared 60,137 90 5,412
FishAGEs (U/g)
Serving (g)
AGEs/serving (kU)
Fish loaf, boiled 90 min7,606 90 685
Salmon, breaded, broiled 10 min 14,973 90 1,348
Salmon, raw 5,573 90 502
Salmon, smoked 5,718 90 515
Trout, raw 7,830 90 705
Trout, roasted 25 min 21,383 90 1,924
Tuna, loaf, roasted 40 min 5,895 90 531
Roasted 25 min 9,189 90 827
White, canned in oil, Albacore 17,396 90 1,566
CheeseAGEs (U/g)
Serving (g)
AGEs/serving (kU)
American, processed 86,775 30 2,603
American, processed, low fat 40,395 30 1,425
Brie 55,979 30 1,679
Cottage cheese 1% fat 14,532 120 1,744
Feta 84,235 30 2,527
Mozzarella, part skim 16,777 30 503
Parmesan, grated 169,020 15 2,535
Swiss, processed 44,701 30 1,341
EggsAGEs (U/g)
Serving (g)
AGEs/serving (kU)
Egg yolk, boiled 10 min 12,134 15 182
Boiled 12 min 18,616 15 279
Egg white, boiled 10 min 442 30 13
Boiled 12 min 573 30 17
Egg, fried with margarine 27,494 45 1,237
TofuAGEs (U/g)
Serving (g)
AGEs/serving (kU)
Broiled 41,067 90 3,696
Raw 7,875 90 709
Sautéed 38,303 90 3,447
BreadsAGEs (U/g)
Serving (g)
AGEs/serving (kU)
Bagel 1,075 30 32
Greek, hard 1,514 30 45
Whole wheat, center 536 30 16
Whole wheat, center toasted 1,080 30 25
Whole wheat, crust 730 30 22
Whole wheat, crust, toasted 1,394 30 36
Breakfast foodsAGEs (U/g)
Serving (g)
AGEs/serving (kU)
Pancake, frozen, toasted 22,618 30 679
Pancake, homemade 9,722 30 292
Waffle, frozen, toasted 28,711 30 861
CerealsAGEs (U/g)
Serving (g)
AGEs/serving (kU)
Bran Flakes 346 30 10
Corn Flakes 2,320 30 70
Frosted Flakes 4,270 30 128
Corn Pops 12,431 30 373
Oatmeal instant, dry 188 30 4
Oatmeal, instant with honey 175 175 31
Rice Krispies 19,997 30 600
Grains and legumesAGEs (U/g)
Serving (g)
AGEs/serving (kU)
Bean, red kidney, raw 1,158 100 116
Bean, red kidney, canned 1,906 100 191
Bean, red kidney, cooked 1 h 2,983 100 298
Pasta, cooked 8 min 1,123 100 112
Pasta, spiral, cooked 12 min 2,420 100 245
White rice, quick cook, 10 min 88 100 9
White rice, converted, cooked 35 min 91 100 9
Starchy vegetablesAGEs (U/g)
Serving (g)
AGEs/serving (kU)
Corn, canned 195 100 20
Sweet potato, roasted, 1 h 723 100 72
White potato, boiled, 25 min 174 100 17
White potato, french fries, homemade 6,939 100 694
White potato, french fries, fast food 15,219 100 1,522
Crackers and snacksAGEs (U/g)
Serving (g)
AGEs/serving (kU)
Chips, corn, Doritos 5,049 30 151
Lay’s Potato Chips 28,818 30 865
Chips Ahoy Chocolate Chip Cookies 16,837 30 505
Oatmeal raisin cookie 13,707 30 411
Cracker, Goldfish, cheddar 21,760 30 653
Chocolate Chunk Granola Bar 5,068 30 152
Peanut Butter Chocolate Chunk Granola Bar 31,761 30953
Popcorn with butter, air popped 1,340 30 40
FruitsAGEs (U/g)
Serving (g)
AGEs/serving (kU)
Apple 127 100 13
Apple, baked 445 100 45
Banana 87 100 9
Cantaloupe 201 100 20
Raisin 201 30 36
VegetablesAGEs (U/g)
Serving (g)
AGEs/serving (kU)
Broccoli, carrots, celery, grilled 2,260 100 226
Carrots, canned 103 100 10
Green beans, canned 179 100 18
Onion, raw358 100 36
Tomato, raw 234 100 23
Other carbohydratesAGEs (U/g)
Serving (g)
AGEs/serving (kU)
Sugar, white0 5 0
Sugar substitute, powder 58 1 0
Milk and milk productsAGEs (U/mL)
Serving (mL)
AGEs/serving (kU)
Milk, whole 48 250 12
Fat free 5 250 1
Fat free, microwave, 1 min 21 250 5
Fat free, microwave, 3 min 345 250 86
Formula, infant 4,861 30 146
Human milk, fresh 52 30 2
Instant, chocolate, skim milk, sugar free 11 120 1
Yogurt, strawberry or cherry, nonfat, sugar free 40 250 10
Syrups, gels and juicesAGEs (U/mL)
Serving (mL)
AGEs/serving (kU)
Honey 87 15 1
Syrup, caramel, sugar free 15 15 0
Dark corn 14 15 0
Apple 20 250 5
Cranberry 32 250 8
Orange, fresh squeezed 3 250 1
Orange, carton 56 250 14
DishesAGEs (U/g)
Serving (g)
AGEs/serving (kU)
Italian pasta salad, homemade 9,346 100 935
Macaroni and cheese, baked 40,698 100 4,070
Pizza, thin crust 68,248 100 6,825
Sandwich, toasted cheese 43,327 100 4,333
BeveragesAGEs (U/mL)
Serving (mL)
AGEs/serving (kU)
Coffee, decaffeinated, instant 53 250 13
Instant 47 250 12
Drip method 15 250 4
On a heating plate more than 1 h 134 250 34
With milk 66 250 17
With milk and sugar 24 250 6
Cola 65 250 16
Cola, sugar free 12 250 3
Tea 19 250 5


CondimentsAGEs (U/mL)
Serving (mL)
AGEs/serving (kU)
Ketchup 103 15 2
Mustard 29 15 0
Soy sauce 573 15 9
Vinegar, balsamic 352 15 5
Vinegar, white 377 15 6


Conclusion

Foods high in fat and/or protein are highest in AGEs, while carbohydrates are low in AGEs. The amount of advanced glycation endproducts increases as cooking temperature and time increases. Processed foods in general have more AGEs than unprocessed foods: for example, infant formula milk contains a 100 times more AGEs than human or cow milk.

For more information on glycation, see these posts:

Yerba Mate Inhibits AGE Formation
Green Tea Reduces the Formation of AGEs
My Current Health Regimen
The 7 Types of Aging Damage That End up Killing You